
I design products, and the systems that let them scale.
I’m a Lead Product and Design Systems Designer working across B2B and B2C products, from e-commerce and product UX to enterprise-scale design systems. I connect strategy, systems thinking and hands-on design to solve complex problems and build experiences that scale.
Featured case studies
Case studies

About
I’m drawn to how things work, why they work that way, and whether there’s a better approach.
I’m interested in more than how a design looks. I care about how it works, how it gets built and how it evolves. My work brings together product strategy, systems thinking and cross-functional leadership to create experiences that are considered, scalable and built to last.
- How I approach problems
When something is inconsistent or hard to maintain, I want to know what’s causing it before I decide how to fix it.
So I investigate, gather evidence, weigh the alternatives, and think about what a decision will cost the people who build with it and maintain it later.
- The problems I like
The ones bigger than a single screen: a component library several teams depend on, a navigation every page shares, a set of templates a whole marketing team builds from.
I like taking something fragmented and making it cohesive, intuitive and sustainable. That always involves trade-offs between what’s ideal, what’s feasible and what a migration will ask of everyone else.
- How I lead
I establish the direction, bring the right people together, and get them aligned. Then I structure the work, make the decisions, and hold the quality bar through delivery.
I’ve led product design initiatives, design teams and design systems programs that way, along with the workshops, design thinking sessions and planning that keep product owners, designers and developers moving in the same direction.
As a strategic individual contributor, I lead designers, stakeholders and whole initiatives, from the first framing of a problem through to delivery.
- Range
I’ve designed B2B and B2C experiences: e-commerce, product UX, navigation and information architecture, enterprise design systems, and visual design and illustration.
I don’t treat product design, visual design and design systems as separate disciplines. Working across them is how I judge both the quality of a single experience and the system that lets a team produce it again and again.
Illustration and painting
More on my art site


Freedom Reins · Brand Identity, Illustration & Digital Experience
A Story Told Across Every Touchpoint
An illustrated book, a visual identity, a website and marketing materials for a nonprofit horse camp, designed as one visual language.
- Role
- Creative Direction · Illustration · Brand Identity · Website Design · Print Design
- Client
- Freedom Reins, a nonprofit horse camp
- Timeline
- 4 months
The project
Freedom Reins is a nonprofit that helps troubled youth. It runs a horse camp where young people can heal, learn and grow by bonding with horses, built on the belief that horses can heal emotionally.
The project began with a commission to illustrate a book about how horses can be healing. From there I developed the wider work: a brand identity, a website design and marketing materials, so the organization’s whole presence could share the book’s visual language.
Creative direction
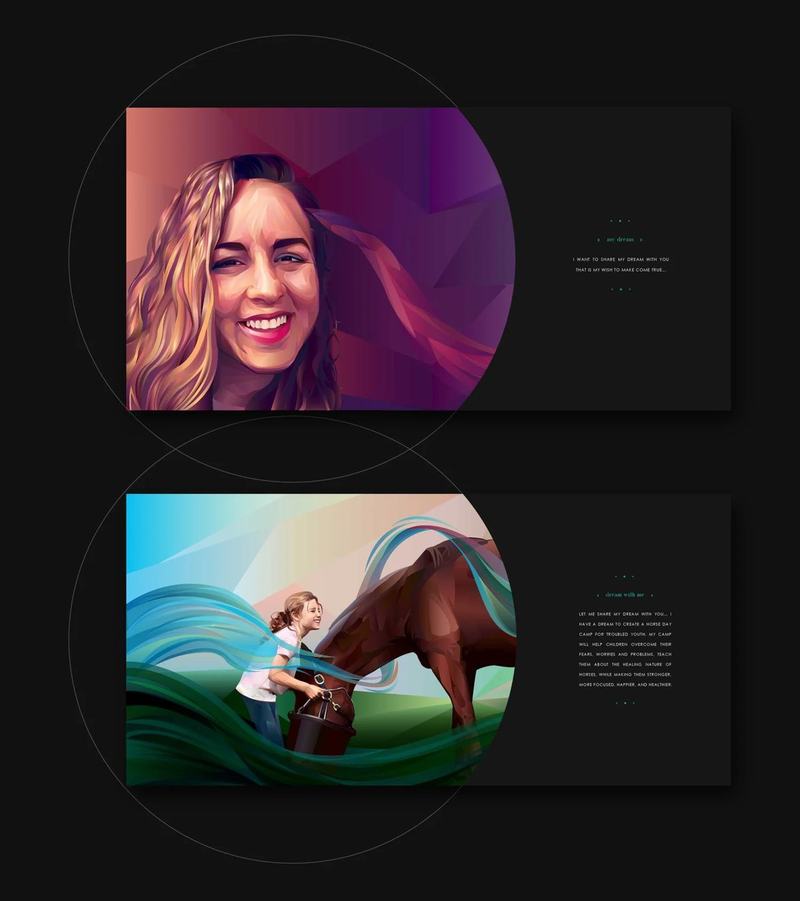
A flowing, ribbon-like form runs through every illustration, and it became the thread that ties the whole project together.
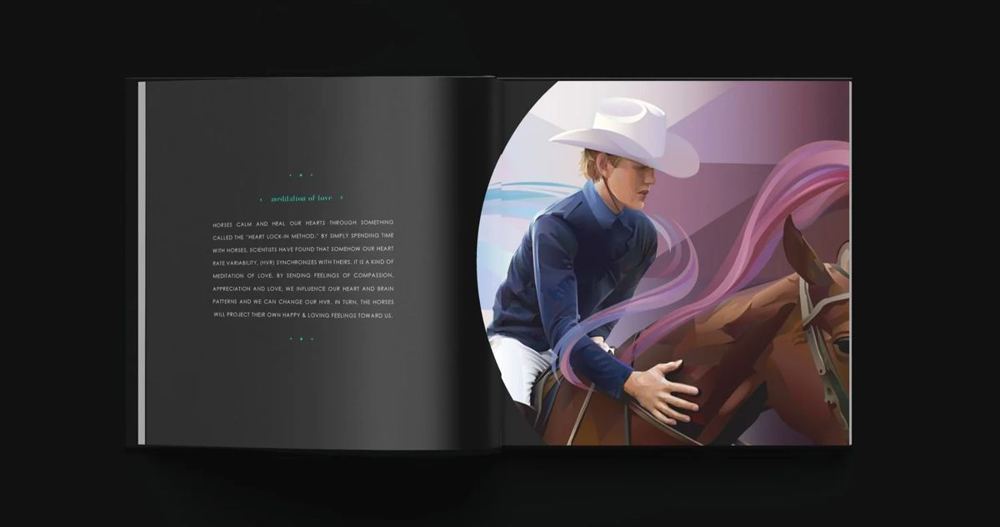
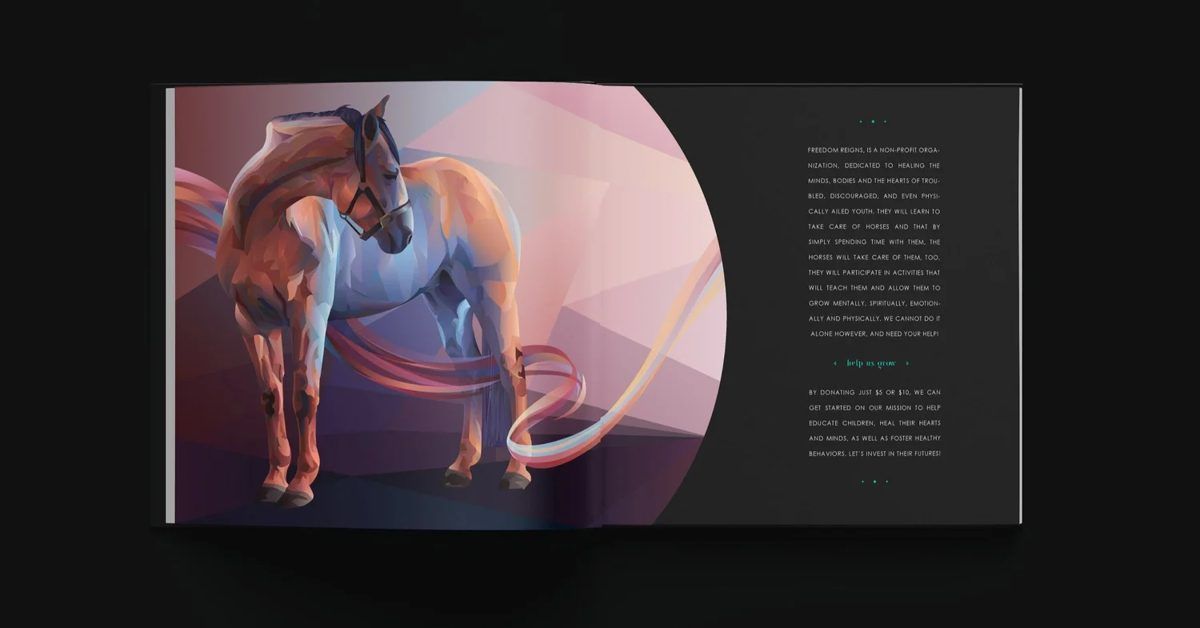
I illustrated a series of scenes for the book, each showing a young person and a horse. The ribbons move through and around the figures in every one. They connect the images to each other, and they carry the themes the book is about: healing, connection and movement.
Because the motif appears across the series and not in a single image, it could travel. It gave the illustrations continuity, and it gave the identity, the website and the print pieces a shape of their own to build from.
Illustration

The book
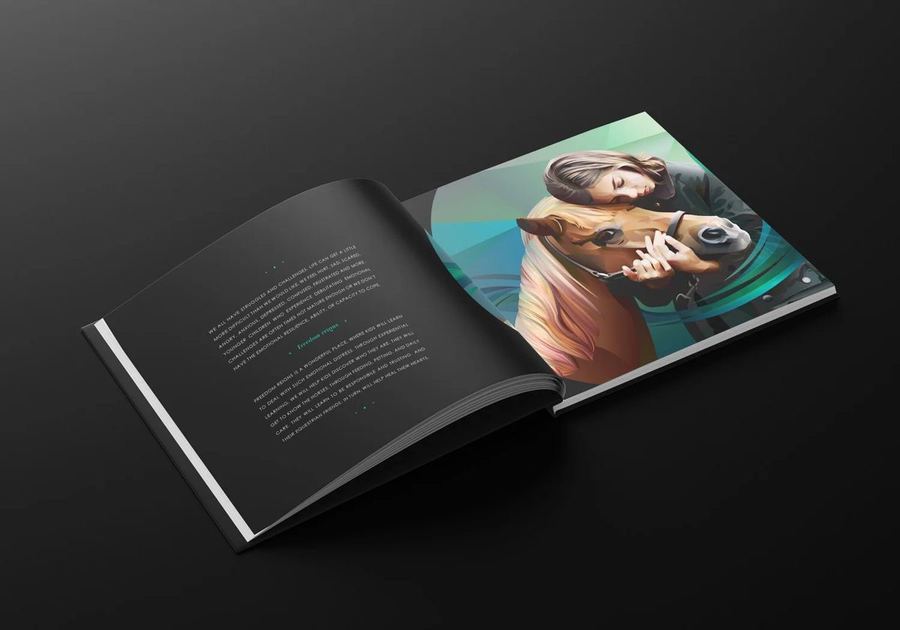
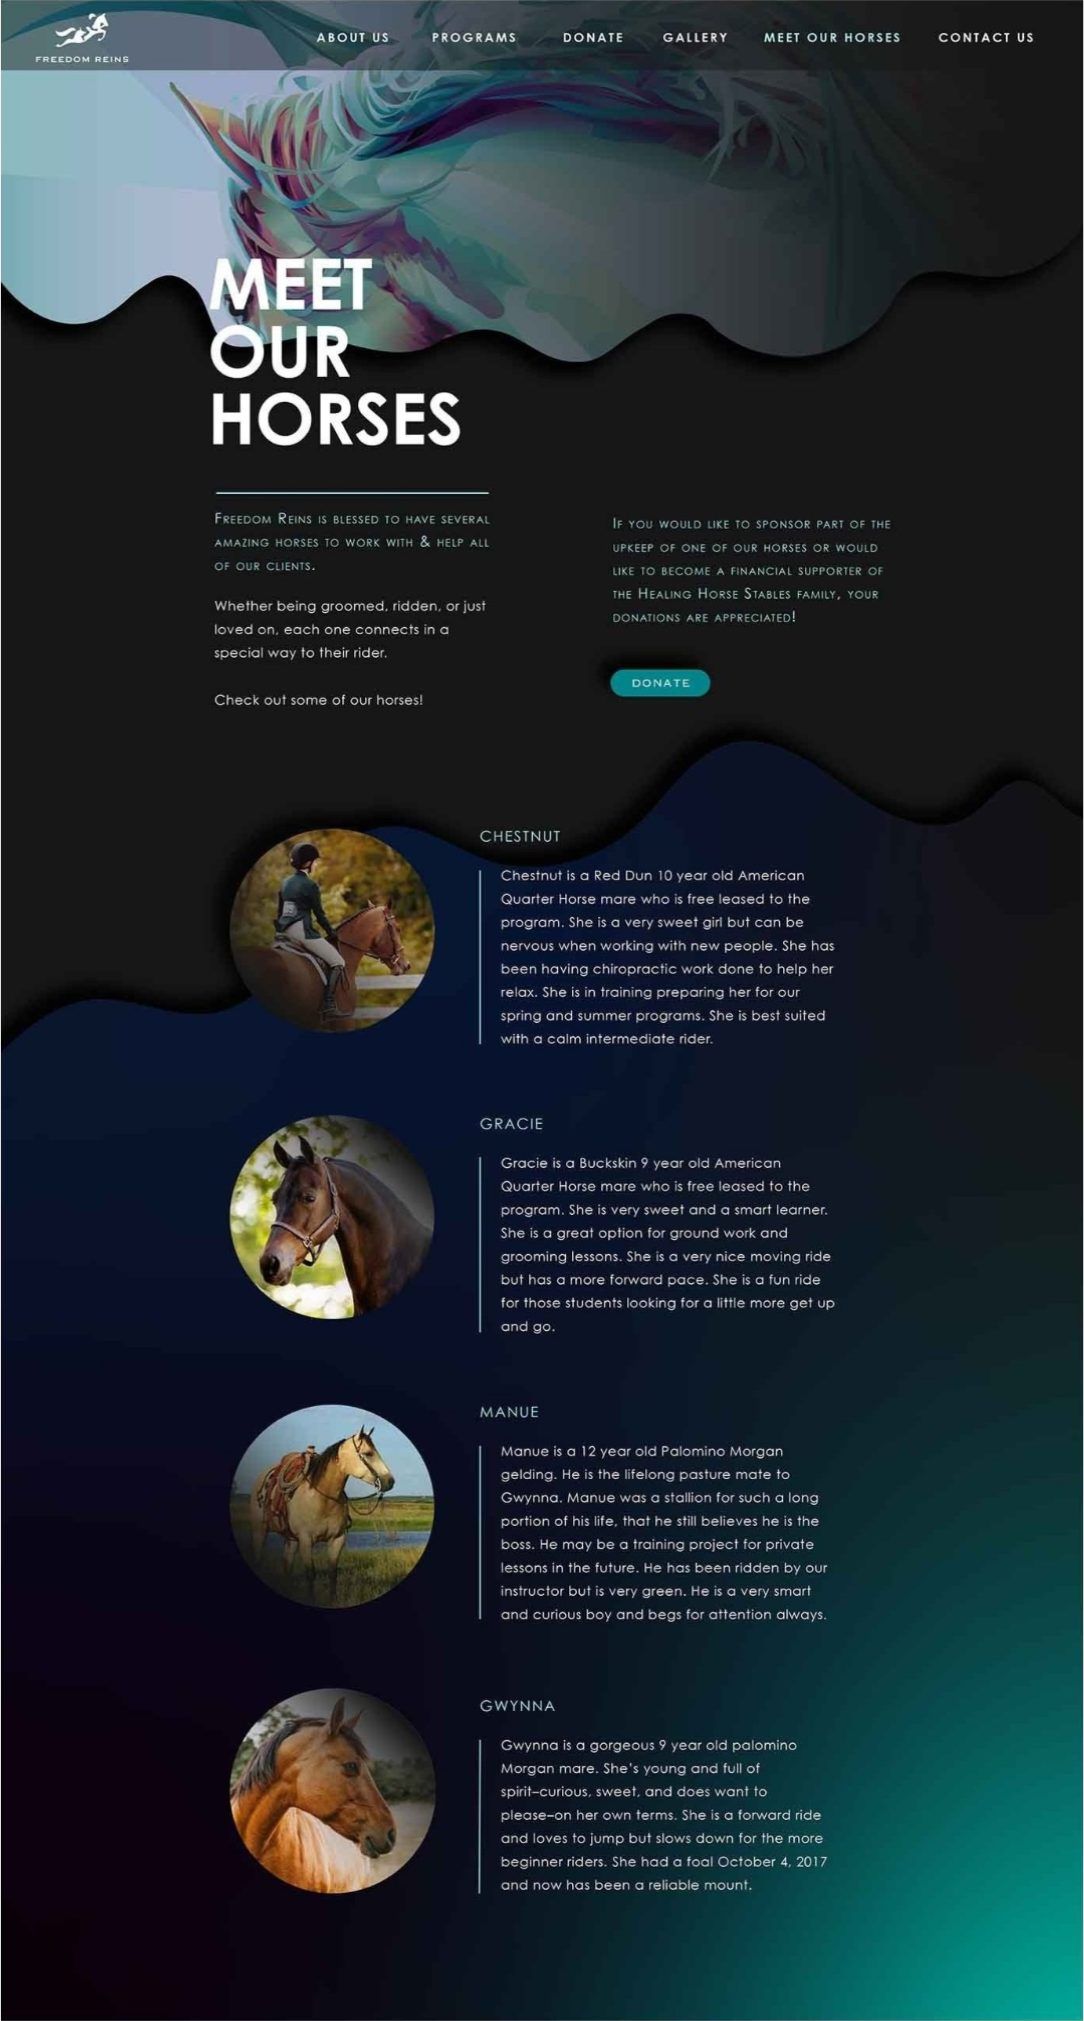
Each illustration sits in a circular crop against a black page, with the text set small and quiet beside it so the image leads.
Identity
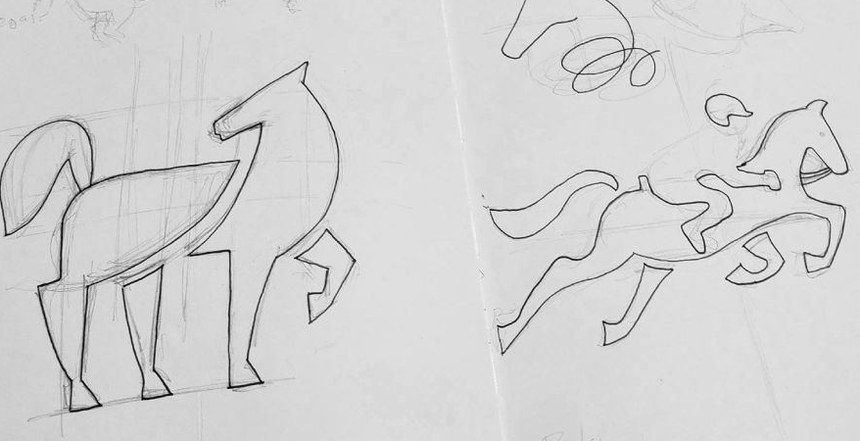
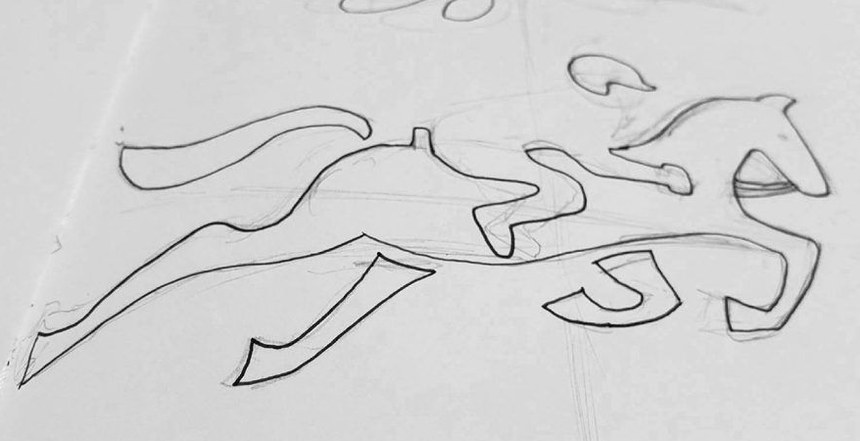
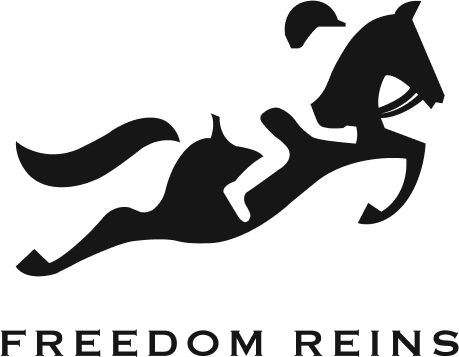
The mark began as pencil studies of a horse and rider in motion and resolved into a single leaping silhouette, refined on a circular construction grid.


Color
- #FFFFFF
- #D4E2E3
- #AAF9F4
- #01AFAD
- #00858C
- #000E31
- #282C2F
- #161616
- #000000
Buttons and icons





Website
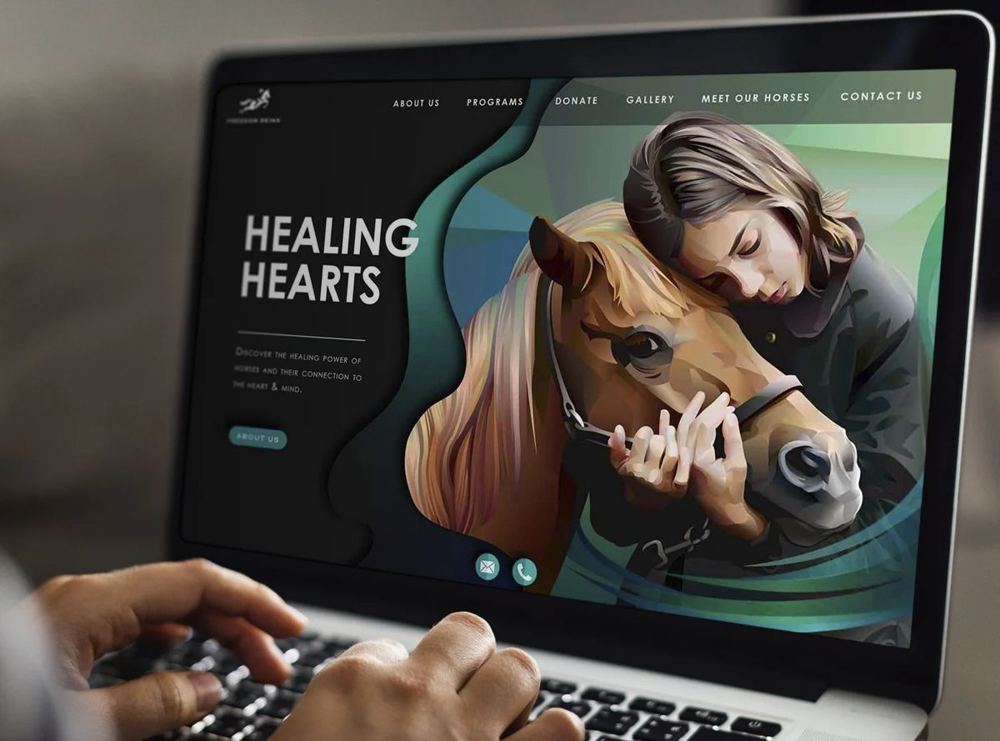
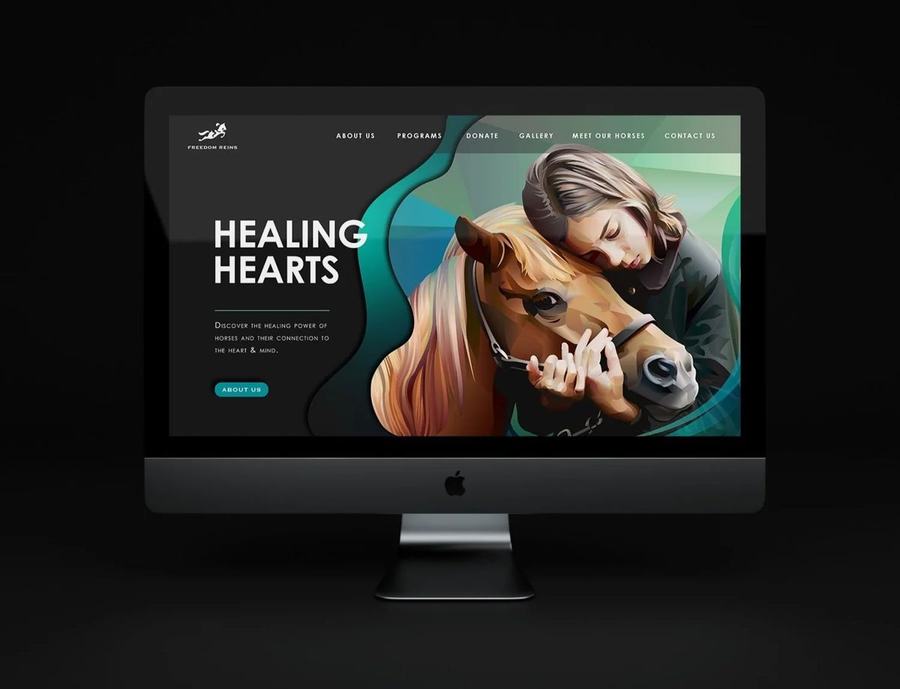
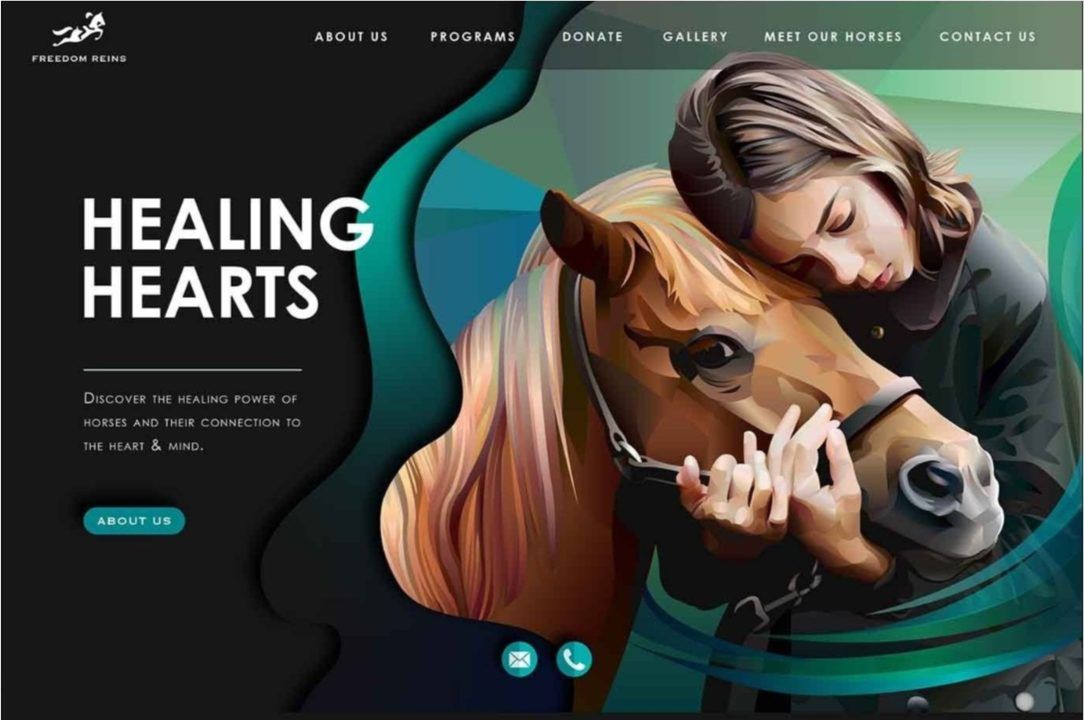
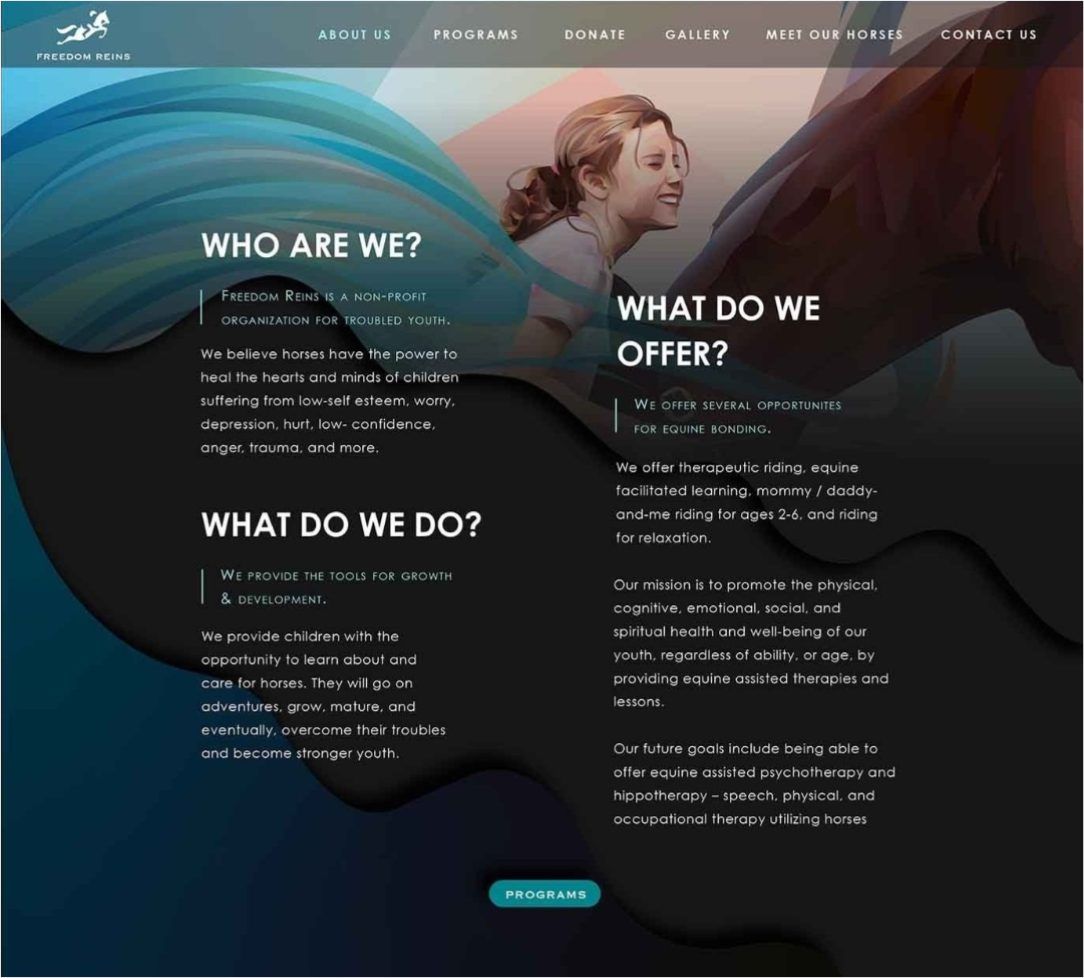
The website brings the ribbon forms from the illustrations into the interface. Curved bands of color shape each page and hold the artwork, which connects the digital experience to the identity without adding ornament on top of it.
It also had to work as a website. Visitors need to understand what Freedom Reins is, what the camp offers and how to sign up. So the curves define sections and never run behind body text, the copy sits in plain columns on solid dark grounds, and light text and teal actions are set against near-black for clear contrast. Each page has one job: who we are, what we offer, meet the horses.
Marketing
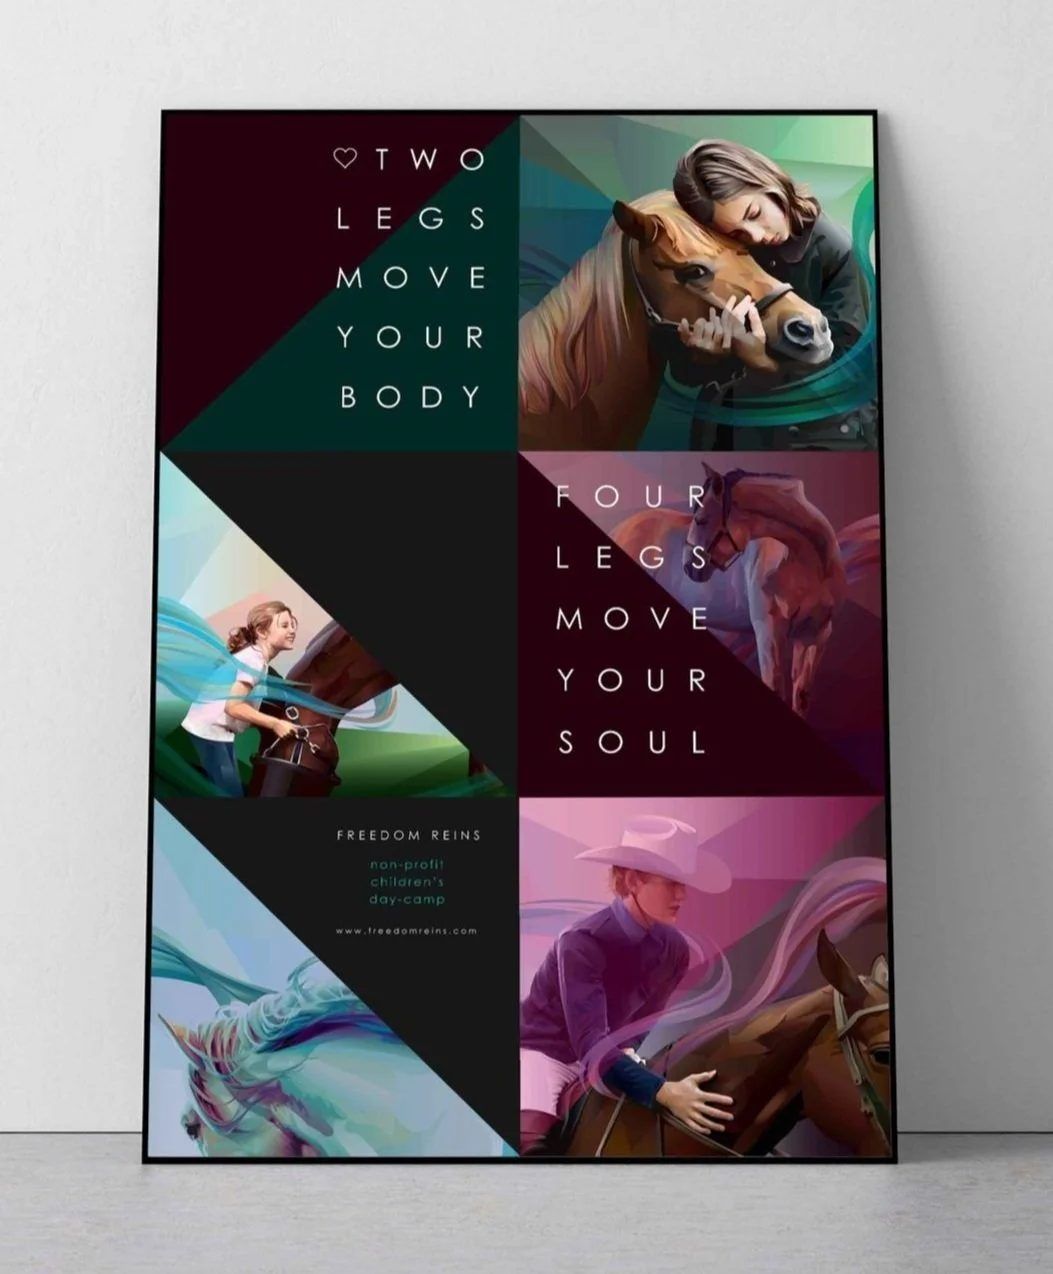
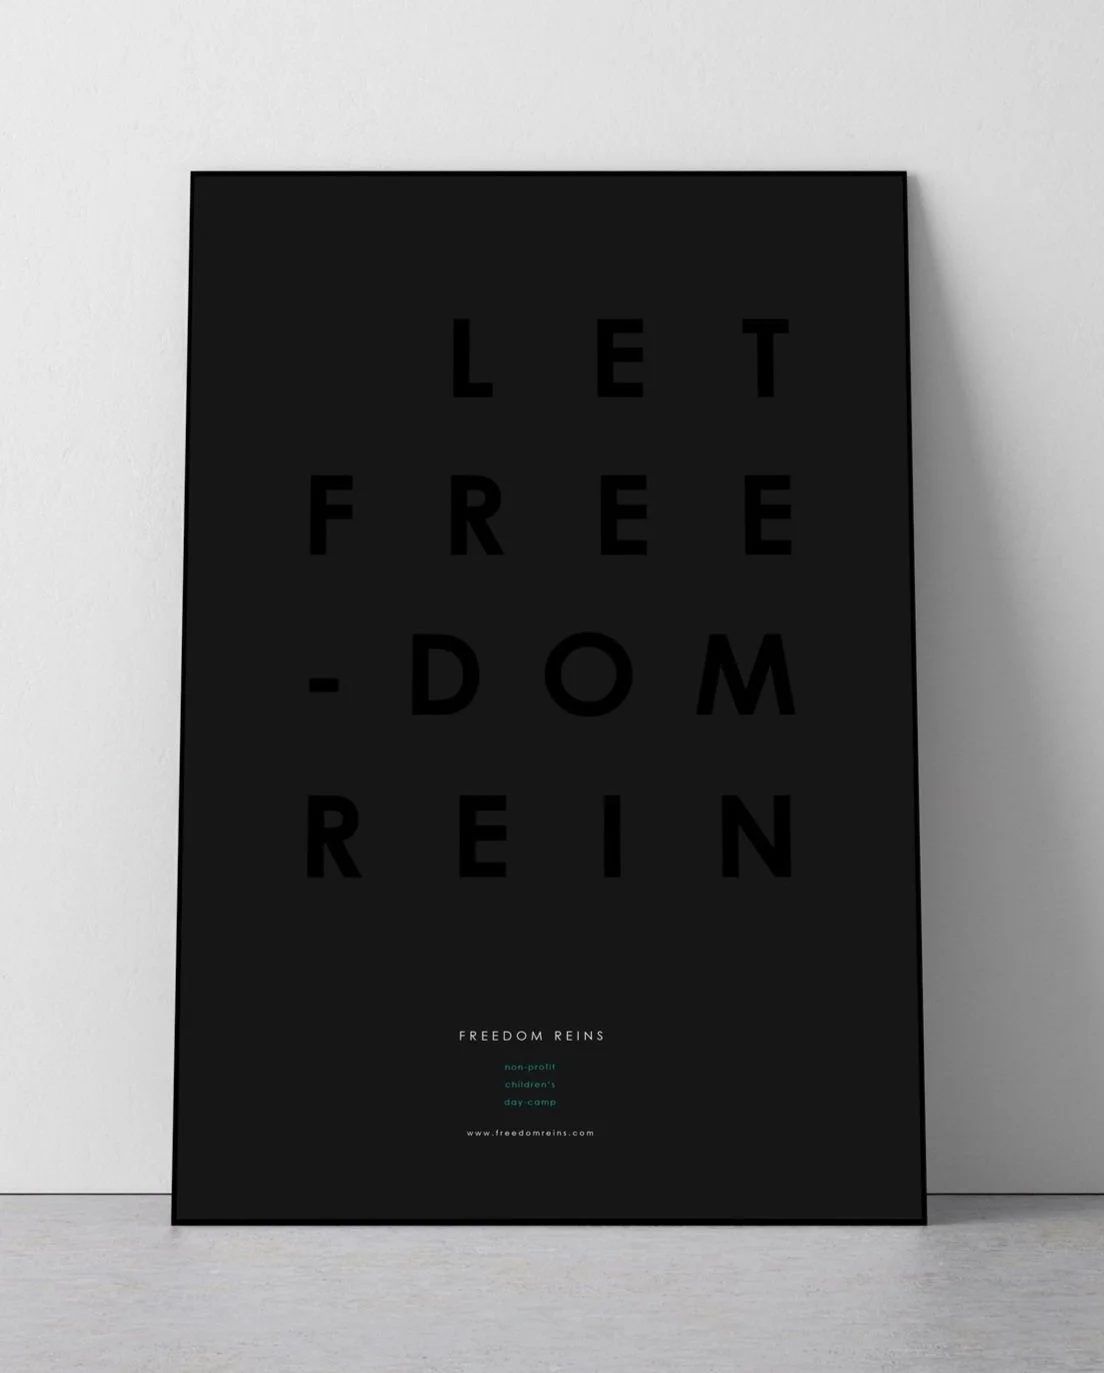
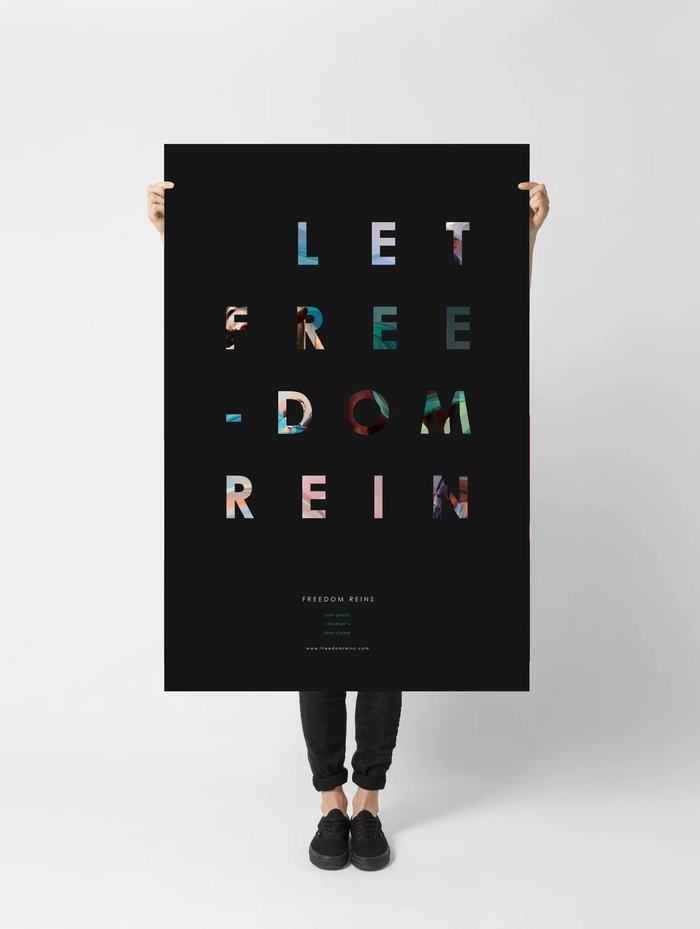
One visual language, carried from a set of illustrations across a book, a mark, a website and print.
Thermo Fisher Scientific · Web Illustration System
From One Page to a Shared Language
What began as a self-initiated fix for one page became a shared illustration language: dozens of illustrations, documented standards and a contribution process that let other designers extend it. It became the default illustration standard across FisherSci.com, ThermoFisher.com and additional Thermo Fisher Scientific applications.
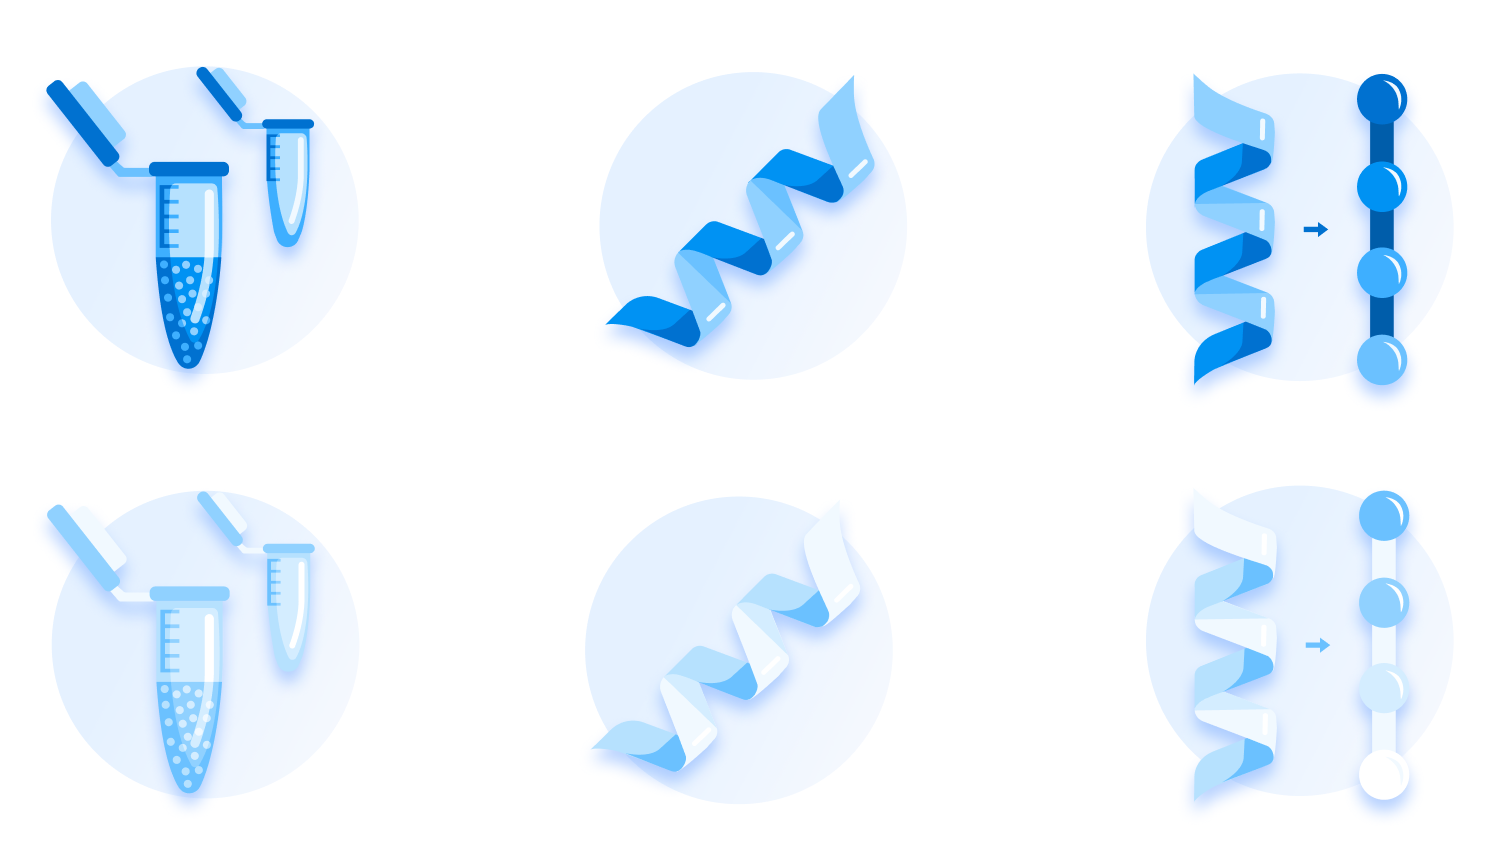
- My role
- Lead UX & Design Systems Designer
- How it began
- Self-initiated, from a single-page redesign
- Delivered
- Dozens of illustrations in bold and subtle variants, with guidelines and a contribution process
- Adoption
- Default standard across FisherSci.com, ThermoFisher.com and additional Thermo Fisher Scientific applications; part of Komodo
The challenge
Illustrations that weren’t doing their job
While redesigning Fisher Scientific’s Help & Support experience, I noticed its illustrations were working against the interface. They didn’t share a style, didn’t connect to the Fisher Scientific brand and felt disconnected from the UI around them.
I started redesigning them for that page. As the new illustrations took shape, other product designers liked the direction and began asking me for illustrations for their own work.
That reframed the problem. One page’s inconsistent artwork was a symptom of something wider: there was no shared illustration language, so every team solved it alone. Rather than keep producing isolated assets, I turned the work into a system other designers could use and extend.
- A local fixI redesign the illustrations on one page.
- Other teamsProduct designers ask for illustrations for their own experiences.
- A shared systemI formalize the work into a reusable illustration language.
The visual direction
Credible enough for science, warm enough for support
The style had to work in two settings: a commercial site where people order and get help, and scientific content where accuracy builds trust.
Visual research & references
I started by reviewing a wide range of product illustration: different styles, levels of detail, color treatments and ways of handling empty states and onboarding.
The goal was to see what makes illustration feel clear, friendly and credible, and where it tips into decoration. That shaped the questions I explored against our own interface: how much detail scientific subjects need, how restrained the palette should be, and what gives a set of illustrations one consistent weight.
A selection of the illustration references gathered during exploration.
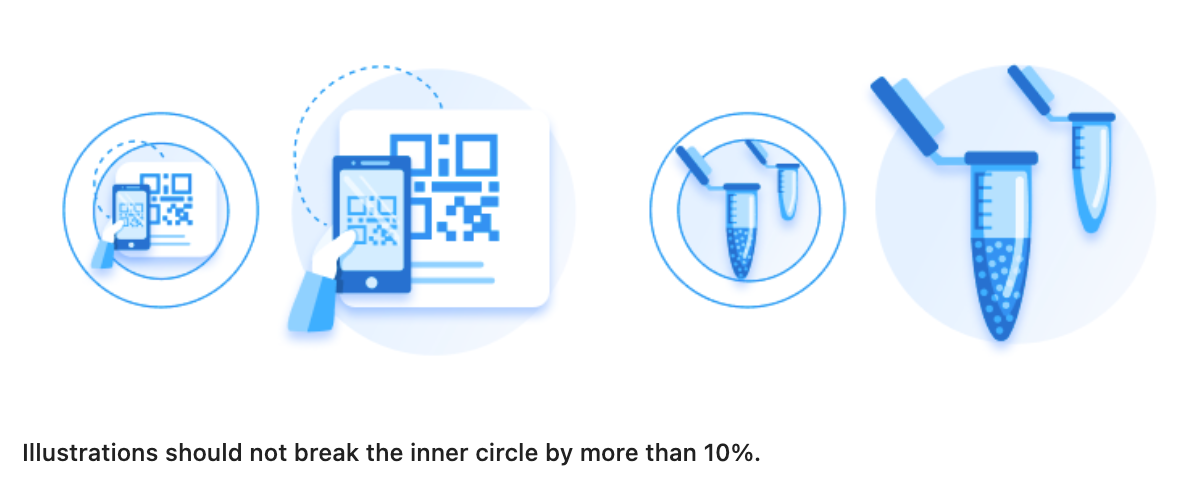
My first direction used organic background shapes and a soft pastel palette. I refined it into a circular background and a single monochromatic blue scale drawn from the brand. The circle gives every illustration the same footprint and visual weight; the blue scale keeps illustrations supporting the interface instead of competing with it.
Brand & Marketing approval
The approved color and shape language became the foundation for every illustration that followed.
I presented the refined direction to Brand and Marketing, who reviewed and approved it, including the circular background and the monochromatic blue scale.
Designing for the experience
Illustration that responds to the interface
These illustrations live inside working interfaces, so they needed to respond to them. Every illustration was drawn in two variants, bold and subtle, so the right treatment could be chosen for its context.

Because both variants always exist, they can also carry state. In interactive components such as selectable cards, an option can use the subtle variant while deselected and switch to the bold variant when selected, reinforcing the choice without adding more UI.
Where illustrations belong
For scientific content, I designed specialized illustrations of equipment and processes, detailed enough to be meaningful without becoming noisy, like the set at the top of this page.
A repeatable language
Built for other designers to extend
A shared language only scales if other people can speak it. I developed comprehensive illustration guidelines covering geometry, construction, composition, color, sizing, visual treatments and usage, giving other designers a consistent framework for creating new illustrations within the established visual language.
The examples below are a snapshot of those broader standards.
Selected illustration guidelines
Two ways to contribute, one quality bar
Product designers could grow the library in two ways: request an illustration, or create one themselves using the guidelines. Either way, every addition went through design systems review before joining the library, so more people could contribute while the standard held.
Accessibility guidance was part of the documentation: text alternatives for every illustration, SVG title and description elements, and meaning that never depends on the image alone.
Outcomes, deliverables & learnings
From one page to the default standard
The illustration system became the default standard across FisherSci.com, ThermoFisher.com and additional Thermo Fisher Scientific applications, and was incorporated into Komodo.
Delivered
Adopted
Intended benefits Design objectives, not measured
- Consistent illustration across products and teams
- Clearer interfaces, with variants that reinforce emphasis and selection
- New illustrations made to a shared standard instead of reinvented
- A library that can grow without fragmenting
Key learnings
- Repeated requests are a product signal. When other designers started asking for the work, the opportunity was bigger than the original page.
- Contribution needs a quality gate. Opening the library to other designers worked because every addition passed the same review.
- A visual system lasts through its process. Guidelines and approval keep the library consistent long after the first set ships.
Started on one page. Became the shared standard.
Fisher Scientific · Global Navigation & Footer
Built Around What People Actually Use
As the sole UX designer, I led the UX work on Fisher Scientific’s global header and footer across a six-month initiative, from research and stakeholder alignment to design, testing and delivery. Analytics showed search carried the experience while most header links went largely unused, so the redesign reorganized navigation around what customers relied on, while meeting the needs of several business groups.
- Role
- Lead UX Designer
- Partners
- Engineering, Analytics, Site Leadership & Business Stakeholders
- Scope
- Responsive global navigation & footer
- Timeline
- 6 months
The navigation problem
One search box, surrounded by links few people used
The header appears on every page of FisherSci.com, and over time it had collected navigation for many audiences: business-group tabs, a utility ribbon, a row of task links, a category menu and account tools.
Adobe Analytics and heatmaps showed how differently those areas were used. Almost half of engaged visits included a click on search. No other area of the header reached 3%.
Share of Fisher Scientific US engaged visits that clicked each header area, 2022 year to date (10,307,020 engaged visits, as of 27 June 2022). A visit can include clicks in several areas, or none.
Heatmaps of the previous header showed the same pattern. Clicks clustered in the search field, with only scattered activity across the category list and task links. Some clicks even landed on the country flag, which did nothing for US customers.
Even the task links were rarely used
What it meant
The header didn’t need more options. It needed to make search unmistakable and keep the few high-value tasks within reach.
Research & information architecture
Deciding what the header is for
The header served several business groups, Fisher Healthcare, Fisher Science Education and e-commerce among them. Each had legitimate reasons to want its destinations prominent, and there was real disagreement over which links deserved priority. Simplifying the header meant aligning those groups, not just reorganizing content.
As the sole UX designer, I facilitated a series of design thinking workshops to bring those perspectives into one conversation. Stakeholders mapped what was working, what was broken and where the opportunities were, clustered the feedback into themes, voted on priorities and weighed them by importance and effort. Several themes mapped directly onto the header: smarter search, order tracking, mobile and accessibility.
The analytics gave the discussion a shared reference. Search drew 49% of engaged visits, while many individually promoted links drew a fraction of a percent. Over successive conversations, that evidence moved priorities away from individual preferences and toward what customers actually used, and support from the Fisher Scientific site director reinforced the customer-centered direction. That alignment is what made a substantial simplification possible.
What the research showed
Interaction concentrated in search, with account, order status and cart far behind. Most other links saw little use.
A search-first hierarchy, with rarely used links moved out of the main row.
Individual task links each drew under 1% of engaged visits.
Browse paths beyond category (application, programs and services, subject, promotions) plus quick links to documents and certificate search, and a consolidated footer.
Customer pain points, preferences and expectations beyond what click data shows.
Customer context for header and footer decisions, alongside the analytics.
Gaps to prioritize across navigation and interactive elements.
Specifications for keyboard navigation, screen-reader support for complex menus, alt text and accessible contrast.
Baymard guidance called for an immediately obvious search field and careful country and language selection; many comparable headers gave search similar prominence.
Confidence in a search-first header and a grouped account menu.
Four priorities
The navigation model
Header
- Search
- Support
- Quick Order
- Account
- Cart
Quick links
- Quick Order
- Apply for a Business Account
- Favorites
- Help & Support
As shipped: the final desktop header and the menu’s browse paths and quick links.
Design strategy & evolution
Making the case for search-first
Two directions took shape. Stakeholders initially favored an expanded two-row header that exposed more links and gave more business priorities a place. I recommended a slimmer, search-first header, built around how customers actually used the site.
Both had merit. The two-row design tested reasonably well, though some usability concerns remained. After further evaluation and stakeholder discussions, we moved forward with the streamlined direction, which also better supported responsive behavior and the navigation being developed for ThermoFisher.com. I then carried it through the final responsive system.
- Stakeholders’ initial preferenceExpanded two-row navigationMore links in view, with room for more business priorities: search and account tools on top, Shop, Documents and Help & Support below.
- My recommendationStreamlined, search-first navigationSearch front and center, key tasks one click away, and browse paths organized in a menu, following the behavior in the analytics.
- The decisionMoving forward with search-firstChosen together after further evaluation, for its focus on search, its responsive behavior and its alignment with ThermoFisher.com.
Inside the exploration
The project file shows how much ground the work covered: header versions through V6, including A/B variants that placed Support or Orders in the header, content variations for different business groups, responsive breakpoints and user types, footer explorations, prototypes, two rounds of testing and developer feedback.
The rationale
Give the most-used actions the most prominence, and keep everything else one organized menu away.
The previous header exposed many destinations directly, yet most drew little engagement. The streamlined direction created a clearer hierarchy and reduced competition between navigation elements, without removing access to the broader site.
A footer that does its job
I split the footer into two layers. A row of flexible quick links lets the business highlight high-priority destinations and commonly used resources, without constantly reworking or expanding the structured navigation below it.
Top · Flexible quick linksA prominent set of links that can change to support current business priorities and important destinations.
Below · Structured footer navigationThe organized, consistent set of links for broader wayfinding.
Evaluation & responsive execution
What testing revealed
Usability testing of the expanded two-row concept, with 20 participants from the general public across countries, ages and education levels, showed what worked and where discoverability needed attention.
Help & Support and product documentation were easy to find. Product categories and the language and country selector were harder. These findings fed a broader evaluation: the final search-first direction was selected through that evaluation, the analytics and stakeholder alignment, rather than a separate round of formal testing.
Prototyping the interactions
Interactive prototypes gathered feedback from customers and stakeholders throughout the work, and showed how the menu, search and account interactions should behave.
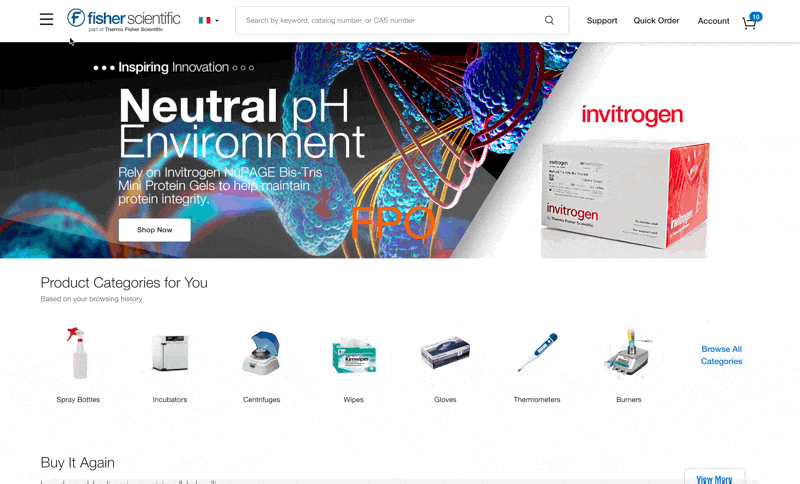
One system, from desktop to mobile
I designed the header, menu and footer across breakpoints from 1440px down to 320px, with separate menu states for guests and signed-in customers, and worked with engineering through delivery.
Accessibility. My specifications covered keyboard navigation, screen-reader support for the menu components and accessible color contrast, based on the accessibility audit. The implementation was reviewed for accessibility after it was built.
Outcomes & deliverables
What changed after launch
In the first post-launch reporting window, more visits engaged with the header and its key tasks.
Before launchAfter launchLarge figure: relative change
Before launch vs. after launch. Before launch: 10 July – 10 August 2023. After launch: 14–24 August 2023. Rates are the share of visits with a click in each area. Point change is the difference between the two rates; relative change is as reported in the original analysis. These are observed changes in an early post-launch window, not a long-term trend.
What shipped
- The redesigned global header and primary navigation
- A search-first navigation structure and mega-menu
- Responsive navigation for desktop and mobile
- A redesigned footer with flexible quick links and structured navigation
- Supporting UX specifications and engineering handoff
Observed outcomes
- Header click visit rate rose from 38.9% to 47.6%
- Order status clicks doubled, from 2.8% to 5.6%
- Menu visits more than doubled, from 1.5% to 3.4%
- Footer clicks rose from 1.2% to 1.6%
Before launch vs. after launch, in the reporting windows above.
Key learnings
- Data creates alignment.When every group wants space in the header, customer behavior is the most useful shared reference. The analytics helped move competing requests toward decisions based on how people actually used the site.
- Recommendations have to be championed.The search-first direction wasn’t the first choice. Clear design reasoning, ongoing stakeholder engagement and further evaluation are what carried it to adoption.
- Simplicity is prioritization.Good navigation doesn’t expose every destination equally. It makes the most important actions effortless and keeps the rest of the site within reach.
Search first. Everything else within reach.
Fisher Scientific · Search Experience Vision
Beyond the Results List
Fisher Scientific sells an enormous range of scientific products, from spec-heavy chromatography columns to simple lab supplies. Customers needed search to do more than return matches: they needed to evaluate, compare and buy with confidence. As Product Design Lead, I led a collaborative North Star initiative, a future-state vision for search that gave product, engineering and business teams a shared direction for incremental improvements.
- Role
- Product Design Lead
- Partners
- Product owners, site leadership, engineering, marketing & content stakeholders
- Scope
- Future-state vision for search & category browsing, desktop to mobile
- Duration
- Approx. 2 months
01 · Where search was falling short
A results list that made customers work for every decision
A search for “columns” returned more than 23,000 results. Finding a match wasn’t the hard part. Choosing between near-identical products was.
The existing page listed products, but much of what a customer needed to decide, such as pricing, specifications, documents and comparison, sat behind extra clicks or wasn’t available in search at all. Category browsing shared the same structure and the same limits.
- Filters in a fixed left columnLong, inconsistently ordered lists that took width away from product data.
- No sorting23,367 results, with no way to bring price or another priority to the top.
- Pricing behind a clickPrice and availability opened one product at a time.
- Small or missing imageryImages were small, sometimes outdated, or showed the family rather than the item.
- Repeated actions in a cramped tableEvery SKU row carried its own Add to Cart, with little room for specifications.
02 · Investigating the experience
Building the evidence before choosing a direction
I organized what we already knew about search alongside new analysis for this initiative, then brought it into collaborative workshops with product stakeholders.
Customer commentary and usability findings accumulated over several years of search work, including testing done for other search initiatives.
A review of search and category browsing using Adobe Analytics, heatmaps and recorded customer sessions.
Baymard Institute and Nielsen Norman Group research, and a review of competitors and industry leaders with similarly data-heavy experiences.
Design thinking sessions with product stakeholders, using LUMA methods to map journeys, surface opportunities and prioritize.
Where attention went
Adobe Analytics and heatmaps showed how customers used the existing page. In the heatmap, activity concentrated on the search field, product names and the Pricing & Availability buttons, while the long filter column on the left saw comparatively little.
Watching a real search
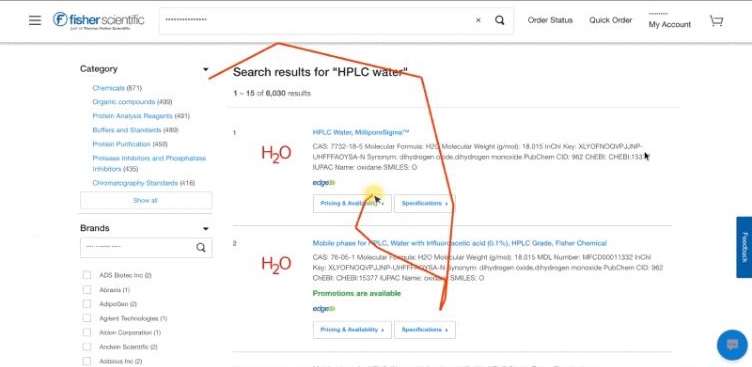
A recorded session from the audit shows a customer searching for “HPLC water”.
To compare options, they open Pricing & Availability on one product, scroll through the results, open it again on another, review each and case pricing, then enter a quantity and add to cart.
Price, pack size and availability appeared one product at a time, so comparing meant opening, scrolling and reopening.
Customer commentary, connected to research
I organized CAS customer commentary by topic, including sorting, filtering, comparison, grid view, purchasing and promotions, and placed it beside relevant Baymard guidance. Each topic ended in an insight and a recommendation, so every proposal could be traced back to what customers said and what research supports.
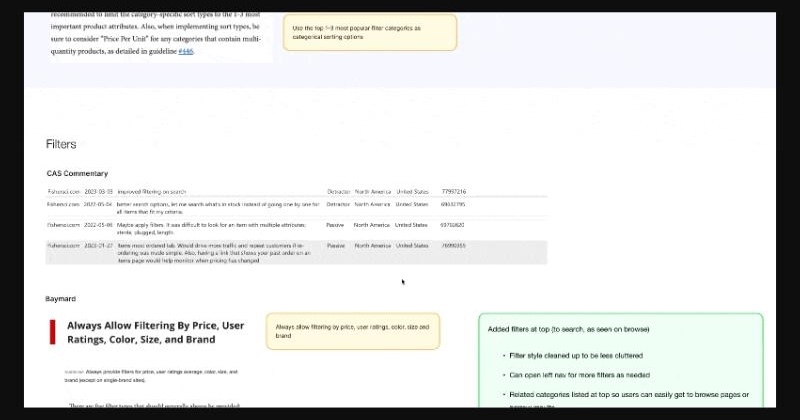
- Customers said
Filtering needed to improve, including a way to see only in-stock items instead of checking products one by one.
- Research showed
Baymard: always allow filtering by price, ratings and other essential attributes; horizontal filter bars perform well and free space for results.
- Insight
Key filters belong above the results, not buried in a long sidebar.
- Recommendation
Popular filters at the top, an All Filters drawer, and filters for In Stock, Stockroom Pickup and price range.
One topic from the board, as an example. Baymard Institute and Nielsen Norman Group are third-party research.
Collaborative workshops
I facilitated design thinking workshops with product stakeholders, using LUMA methods to review search and category browsing together. Working from customer journey maps and user stories kept the discussion anchored in how people actually find and buy products, rather than in individual feature requests.
- Journey mappingWalk the customer’s pathJourney maps and user stories traced how customers start, find and decide, and buy.
- Rose, bud, thornCapture what works and what doesn’tAt each step, we noted strengths, potential and pain points.
- Affinity mappingFind the opportunitiesNotes were clustered into opportunity areas, and we discussed potential improvements for each.
The clusters made the scale of the opportunity visible. Pain points weren’t isolated to one control; they ran through the whole decision.
- Search
- Filters
- Sort
- Documents & Certificates
- Product Compare
- Promos
- Availability
- Product Images
- Display Details
- Quantities
- PDP
Prioritizing what to tackle first
Importance vs. difficulty
From a long list of opportunities to an order of work.
We ranked potential improvements with an importance-versus-difficulty matrix. Placing each idea by its value to customers and the effort it would take showed which features to tackle first, which needed more investigation, and which belonged to the longer-term vision. Because the ranking came out of the same workshops, prioritization grew directly from the opportunities the group had identified together.
03 · From research to a future direction
What the evidence pointed to
The goal wasn’t a single redesign to launch. It was a future-state vision: a shared picture of where search could go, so individual improvements could be prioritized, designed and built toward the same destination.
Thousands of similar results, with no reliable way to reduce them by the attributes that mattered.
Related Categories, exposed filters with an All Filters drawer, sorting, and full width for results.
Evaluating products meant opening them one at a time, as the recorded session shows.
Visible pricing and price ranges, and specifications available in place within results.
Telling similar SKUs apart meant holding details in memory across pages.
Views and Quick View patterns matched to the product’s complexity, with comparison in Table View and better imagery.
Certificates and product documentation meant leaving search.
A Product Documentation tab, and Related Documents for products and product families.
Where design ends and search technology begins
Not every search problem is an interface problem.
Relevance, ranking and the quality of catalog data, including product images and descriptions, depend on the search engine and product content. The North Star focused on what design could change: how results are presented, refined, evaluated and acted on.
Three customer needs
I grouped the proposed experience around three things customers are trying to do, following the find, decide and buy stages of the workshop journey map.
Narrow a large technical catalog to the right products and content.
- Related Categories
- Exposed filters & All Filters drawer
- Sorting
- Tabs for Documents, Special Offers & Programs and Learning Resources
Examine products in the way their complexity requires.
- List, Table and Grid views
- Detailed specifications & table comparison
- Quick View patterns
- Favorites, ratings & better imagery
Keep the information and actions needed to buy where the decision happens.
- Visible pricing & availability
- Consistent product badging
- Quantity & purchasing controls
- Subscribe & Save, Buy Now and promotion explorations
Experience opportunities explored
Beneath those three needs, the North Star explored a broad set of patterns. Several are shown in depth in the sections that follow.
Find & Refine
Refine
- Exposed Related Categories
- Exposed filters beneath Related Categories
- Additional filters in a slide-out All Filters drawer
- Removable filter selections
- Search Within Results
- In Stock and Stockroom Pickup filters
- Price Range filter
Organize
- Sorting improvements
Beyond products
- Product Documents tab
- Special Offers & Programs tab
- Learning Resources tab
Evaluate & Compare
Views
- List View
- Table View, with sortable, customizable columns
- Grid View
Product detail
- Product-family information and technical specifications
- Expandable, in-place product specifications
- Three-product comparison within Table View
Quick View
- Detailed, table-based Quick View for complex products
- Simplified, image-focused Quick View with dropdown selection for simpler products
Save & assess
- Favorites
- Add to List
- Product ratings
- Larger, improved product imagery
Decide & Act
Price
- Visible pricing and price ranges
- Unit-of-measure price options, such as Each or Pack of 4, with the price per unit
- Sale pricing
Availability
- Product availability and stock status
- Estimated delivery information
- Delivery and pickup badges
- Low-stock and discontinued-item messaging
Badges
- Purchase-history badges, such as Buy It Again
- Consistent product-program and marketing badges
Purchase
- Quantity controls and one Add to Cart per selection
- Buy Now in Quick View and Grid View
- Subscribe & Save, including a Start Subscription shortcut beside purchase history
- Applying available promotional offers
Cross-cutting design explorations
- Light and dark theming, explored alongside broader design-system theming
- Product imagery that stays visible and appropriate against different backgrounds
- Responsive mobile experiences
- Different information-density requirements across product types
Design explorations, not necessarily implemented features.
04 · Designing for different product needs
Different products need different experiences
Some products have extensive technical attributes, many configurations and specifications customers must understand before buying. Others are straightforward: a clear image, a few essential details and a simple way to choose an option.
A single information-dense interface doesn’t serve both. Oversimplifying hides what customers evaluating complex products need. So rather than search for one universal layout, we explored a flexible system of views and Quick View patterns matched to the product and the decision being made.
The design question
How much product information does a customer actually need to make a confident decision?
Three ways to evaluate results
List, Table and Grid were designed as complementary ways to evaluate the same results, each suited to different products and tasks. None was meant to replace the others.
List View
Table View
Grid View
Quick View: matching detail to product complexity
Most of the catalog is sold as product families: SKUs that share some specifications and differ in others. The existing Pricing & Availability panel packed every SKU into a small, dated table, repeated Add to Cart on every row and left documents out entirely.
We explored different Quick View patterns based on the complexity of the product. Detailed product families could benefit from a specification-rich table, while simpler products could use a more visual experience with straightforward option selection.
Existing Quick View
Option A · Detailed, table-based Quick View
Option B · Simplified, image-focused Quick View
Option A and Option B aren’t competing finalists. They’re two levels of information density for two kinds of product, and part of the same flexible system.
How the design took shape
The work moved through wireframes, prototypes and multiple rounds of design and critique, and it didn’t move in a straight line. Quick View went through several iterations before the two patterns above, and Table View through more than one structure. Each view was explored as its own question, then brought back into one consistent system.
05 · Bringing the vision together
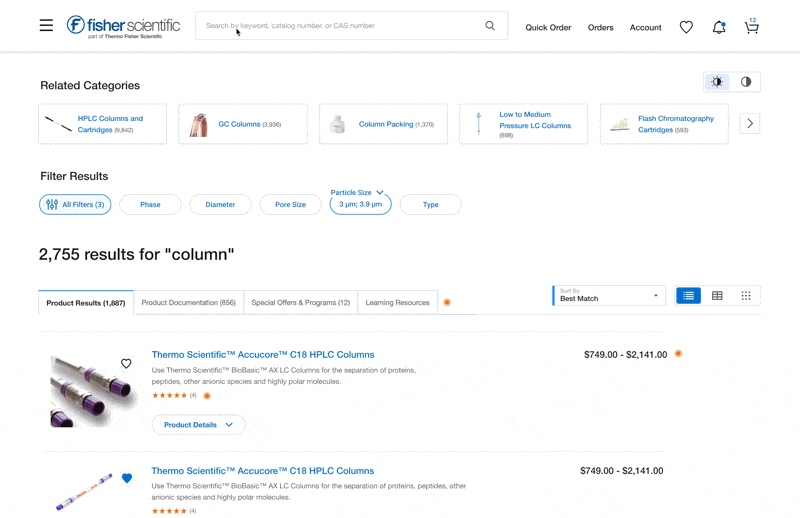
One connected discovery experience
The vision went beyond filters and layouts. Search became a place to find products and the material around them, evaluate them at the right level of detail, and act without leaving the page.
Finding more than products
Related Categories and exposed filters sit above the results, where customers were already looking. Content tabs connect products to documentation, special offers and programs, and learning resources: the material customers otherwise had to find somewhere else.
- Related CategoriesCategory shortcuts, with counts, lead into a narrower browse path.
- Exposed filtersKey attributes sit below Related Categories; selections stay visible, and the rest open in All Filters.
- Content tabsProduct Documentation, Special Offers & Programs and Learning Resources beside product results.
- SortingA Sort menu with Best Match by default and other sort types. Still an open problem, below.
- View modesList, Table and Grid.
An open problem
Sorting a catalog this varied
The catalog spans a massive variety of products with inconsistent levels of product information, and some details were available only inside product families or Quick View rather than directly in search results. That made meaningful sorting across the catalog difficult. We were investigating possible solutions; sorting remained in discovery.
Deciding and buying in place
- Visible pricing & availabilityPrice ranges on product families, and stock and delivery where customers compare.
- Consistent product badgingUnlabeled glyph icons become readable badges, with tags for popular products, stockroom pickup, recent purchases and promotions.
- Quantity & purchasing controls, exploredOne primary action with better quantity controls, in place of an Add to Cart on every row.
- Subscribe & Save, exploredSubscription pricing with a savings badge, for recurring orders.
- Buy Now, exploredA faster single-item checkout, investigated for Quick View and Grid View.
- Promotions, exploredWays to apply available promotional offers where customers choose, such as the “Apply 20% promotion” option in the designs.
The experience as a whole
Designed for smaller screens
Because the products are data-heavy and used in lab and medical settings, most customers shopped on desktop. The experience still had to work on a phone. The question wasn’t how to shrink the desktop page, but what each view could not afford to lose.
06 · From vision to incremental progress
From vision to incremental progress
The North Star was never meant to launch as one large redesign. It gave the team a cohesive vision against which individual improvements could be explored, prioritized, developed and implemented over time, each at its own pace.
A vision that spanned many teams
Each part of the experience depended on different technical and content systems, so moving the vision forward meant working across the teams that owned them.
- Product owners & site leadershipPriorities and the roadmap for search
- Engineering & developmentNew views, comparison, filtering and how search data reaches the page
- Marketing & badgingPromotions, program badges and consistent labeling
- Documentation & content sourcesDocuments in search, product imagery and product data
Where the work went
Individual initiatives progressed at different rates, from built features to active discovery. Developed means built; it doesn’t by itself mean released to customers.
Developed
- Exposed Related Categories
- Exposed filtering controls beneath Related Categories
- Search Within Results
- In Stock and Stockroom Pickup filters
- Price Range filter
- Product ratings
- Favorites
- Add to List
- Visible prices and price ranges
- Stock status with estimated delivery
- Delivery and pickup badges
- Low-stock and discontinued-item messaging
Developed, not released
- Table View
- Expandable, in-place product-family technical specifications
- Three-product comparison within Table View
In development
- All Filters slide-out drawer, as part of the new filtering experience
- Consistent product-program and marketing badges
On the roadmap
- Product Documents tab
- Special Offers & Programs
- Learning Resources
- The updated, detailed table-based Quick View, advanced through planned product work
In discovery
- Sorting improvements
- Simplified, image-focused Quick View with dropdown selection
- Larger, improved product imagery
- Sale-price treatments
- Promotional interaction concepts
- Subscribe & Save
- Buy Now in Quick View and Grid View
- Quantity controls and one Add to Cart per selection within Quick View
- Purchase-history badges
- Light and dark presentation modes, as exploratory design work
Active explorations, not rejected ideas.
Key learnings
- The strongest direction comes from connecting the evidence.Customer feedback, analytics, previous usability findings and stakeholder expertise each revealed different parts of the problem. Bringing them together helped us identify opportunities and prioritize improvements beyond individual feature requests.
- Information density should follow the decision.A complex product family and a straightforward supply item don’t need the same experience. Designing flexible views and Quick View patterns allowed us to explore how much information customers needed without overwhelming simpler purchasing tasks.
- A North Star is most useful when it guides what happens next.The vision gave product, engineering and business teams a shared direction while individual improvements moved through prioritization, development and further exploration. The value wasn’t launching everything at once; it was making incremental decisions part of a coherent experience.
From a list of matches to a place to decide.
Thermo Fisher Scientific · Data Visualization System
Making Data Make Sense
A shared, accessible data visualization system for Komodo, built for Thermo Fisher Scientific’s brands, products and platforms.
As the Komodo Design System lead, I established a data visualization library within the system: accessible color scales, chart standards, interaction guidance and reusable documentation that help teams communicate complex information more clearly and consistently.
- Role
- Komodo Design System Lead
- Scope
- Research, accessibility, visual design, information architecture, guidelines and documentation
- Duration
- About 6 months
- Collaborators
- Two UX designers
- Design Systems
- Data Visualization
- Documentation & Guidelines
- Accessibility
01 · The problem
No shared standard for data visualization
Thermo Fisher Scientific’s brands and applications were each creating data visualizations their own way, with different chart conventions, colors, behaviors and approaches to accessibility.
The need first surfaced through UX work for the Finance organization. Komodo didn’t yet have centralized data visualization standards, and the team kept receiving questions it couldn’t answer consistently, so as the Komodo lead I expanded it into an organization-wide design system initiative. Instrument software, analysis tools, inventory systems and web platforms all had real, different needs, so the answer couldn’t be one identical chart for everyone. It had to be a shared system that each product could apply to its own use cases.
- Inconsistent design and colorVisualizations varied across and within platforms, with no standards for designers or developers to follow.
- Ineffective chartsMany failed to clearly communicate the insight they were meant to show.
- Weak hierarchyCharts lacked clear prioritization, so it was hard to see what mattered most.
- Information overloadToo much data at once made key insights easy to miss.
- Limited interactivityUsers asked for ways to filter, manipulate and customize data views.
- Accessibility gapsSome users couldn’t fully engage with the charts at all.
Auditing what teams already built
I started by collecting the visualizations already in use, reviewing them in context and sorting them by chart type. The audit made the problem concrete: the same chart type was being solved several different ways, and science-specific views such as plate maps, traces and DNA tables needed guidance no general system covered.
Project goals
- Establish consistent data visualization standards across products and brands.
- Improve accessibility and clarity across chart types and user needs.
- Provide centralized, actionable guidance for designers and developers.
02 · Research
Researching the right foundation
I led the research and the design direction: what other systems and libraries covered, what accessibility required, and what each brand and application actually needed.
I researched needs across product areas and brands, working with designers, developers, subject-matter experts and stakeholders. I collaborated with two UX designers on research and workshops while leading the overall design direction, color system, documentation architecture and visual execution.
- AuditExisting visualizations
- Competitive analysisSystems and libraries
- Expert consultationUserWay and Highcharts
- WorkshopsVoting and prioritization
- DirectionLibrary structure and MVP
Competitive analysis
I reviewed Google Material and IBM Carbon to see how deep their data visualization guidance went and how they handled accessibility and WCAG. I evaluated Apache ECharts and Highcharts for how they handled accessibility and interaction behaviors across chart types, and researched chart types, interactions and visual communication practices.
The research set the bar for the guidelines: they needed anatomy, color, behaviors and chart selection, and accessibility had to go deeper than contrast, into interaction and alternatives to color. But they also had to stay short enough that designers and developers would actually use them.
- Expert consultation
- Outside expertise where it mattered most
- UserWay
- I consulted UserWay’s accessibility specialists and directors on usability and accessibility guidance, and to validate the approach across data types.
- Highcharts
- I spoke with Highcharts representatives about how their library handles accessibility and interaction.
- Subject-matter experts
- I met with the people building data-heavy applications to understand their needs, pain points and workflows.
Cross-team workshops
I led workshops with designers, developers and stakeholders working on data visualization across the brands and applications. Together we built consensus on the content and structure of the shared library, the standards every product context needed, which chart types to prioritize and the scope of the first release.
- Design direction
- What the research shaped
- Scope
- An MVP the group agreed on. The matrix placed getting started, color and anatomy at high importance and low difficulty; bar, line and donut or pie became the first detailed chart pages.
- Structure
- Six areas that match the questions designers and developers actually asked.
- Accessibility
- Built into color, labels and behavior from the start, not added at the end.
03 · Designing accessible color
Color that holds up for every reader
In a chart, color carries meaning. It had to stay distinguishable for people with different visual abilities, on light and dark backgrounds, and alongside Thermo Fisher Scientific’s brand.
I based the primary and secondary data colors on the brand’s teal rather than its red. Teal stays distinguishable for people with visual impairments, including red/green color blindness, and complements the rest of Komodo. The scales extend Komodo’s palette wherever possible, so charts feel on-brand without blending into the interface.
Exploring before deciding
I explored ramps, contrast scales and categorical sets in Figma, and tested every candidate in real chart types, in light and dark mode, before narrowing down. Seeing a palette in a stacked bar or a scatter plot exposed problems a row of swatches never would.
Selected scales, by type of data
Different data needs different kinds of difference. Distinct series need hues that are as distinct as possible; ordered values need an even step in lightness; values around a reference need two directions; status needs a cue that works without color.
Final scales
Categorical
Distinct series, applied in order. Six or fewer; bundle the smallest values into “other”.
Extended categorical
For charts that need more than six categories, used in order after the core six.
Sequential
Ordered values, light to dark. Monochromatic scales use a single hue; multi-hue options add range.
Divergent
Values in two directions around a reference point, such as a risk ramp.
Sentiment
Trend and status. Small indicators only, always paired with an icon.
A palette with an order
I sequenced the categorical palette deliberately. Colors are applied in their established order, so a chart with three series always uses the first three, and the same series keep the same colors from chart to chart.
I evaluated the colors together, in that order, under grayscale, protanopia and deuteranopia simulations, designing the sequence to keep neighboring colors distinguishable across those conditions, not only in typical color vision. Where two colors converge, as some do in grayscale, labels and patterns carry the difference.
One system, several brands
Fisher SciApps needed a monochromatic scale that matched its blue-branded interface rather than the standard teal. Instead of letting it diverge, I added a blue monochromatic variation within the shared guidelines, an eight-step light-to-dark ramp like the teal one, so SciApps could stay on brand without leaving the centralized standards.
Testing with the people who read the charts
We tested the color scales with color-blind and non-color-blind participants, and those findings fed directly into my color-system decisions. Usability testing also included people with visual impairments, from internal teams and from UserWay.
Alongside that, I reviewed the approach with UserWay’s accessibility directors and evaluated each scale with contrast checkers, accessibility tools and color-vision simulations, so pairings could be refined before they reached the library.
Never color alone
The guidance asks for direct labels, patterns and textures, icons and alternative text alongside color, so meaning survives for anyone who can’t rely on it. Sentiment colors appear only as small indicators paired with an arrow.
04 · Structuring the library
From workshop notes to a documentation experience
I led the structure and information architecture of the guidelines, created their visual guidance and built the documentation experience in Storybook, within Komodo.
It had to work for designers and developers across Thermo Fisher Scientific’s brands, applications and platforms: easy to find, quick to understand and clear enough to apply without asking.
-
1 · Sitemap
Structuring the content
A sitemap of sticky notes made the architecture visible so designers and stakeholders could decide together. It also surfaced the questions to resolve, such as where accessibility and keyboard navigation should live, whether developer resources belonged in their own section, and putting chart types in the side navigation rather than tabs, because there were too many for tabs.
The proposed structure, with open questions noted beside each area. -
2 · Wireframes
Placing it inside Komodo
I wireframed how data visualization would sit in Komodo’s navigation, alongside guidelines, components and accessibility, with each topic organized into overview, specs, usage, motion and code.
Early wireframes explored how the guidance could be organized inside Komodo. -
3 · Documentation architecture
Six areas, one entry point
Each area answers a question someone building a chart would ask: how it’s built, how to color it, how to make it readable, how it behaves and which type to choose.
- Chart AnatomyStandardized elements that help users focus on trends and insights.
- Color GuidelinesRules for accessible, effective color in data visualization.
- Do’s & Don’tsBest practices that help people interpret data clearly.
- Behaviors & ActionsStates and interactions such as hovers, tooltips and highlighting.
- Chart TypesCommon charts, with an overview and when to use each.
- Developer ResourcesReserved for future expansion.
The final Storybook experience
I designed and built the documentation in Storybook, inside Komodo’s navigation. Each page pairs short guidance with my illustrations and examples, so the rule and what it looks like sit side by side, with a contents rail for longer pages.
- Chart AnatomyAnnotated rectangular and circular charts, and legend placement.
- Color GuidelinesEach palette, its intended use and simulation previews.
- Chart TypesFilterable illustrated cards that flip to an overview.
- Do’s & Don’tsSide-by-side examples of better and worse choices.
- Behaviors & ActionsTabbed examples of interactive legends and hover and select.
05 · Making the guidelines usable
Guidance you can see, not just read
Guidance fails if it’s a wall of rules. I illustrated every chart type and built documentation covering overviews, anatomy, behaviors, accessibility guidance and do’s and don’ts, with a visual example for each decision.
Chart types
I drew each chart in its simplest form so it’s recognizable at a glance, and tagged each card by the insight it supports: comparison, trend, part-to-whole, correlation and more.
Flipping a card reveals a short overview, when to use it and a link to deeper guidance, so people can scan the whole set and only read what they need. The box plot card below works the way it did in Storybook.
Chart anatomy
Shared names and placement for the parts of rectangular and circular charts, plus legend placement options. Consistent anatomy helps people focus on trends and insights, and keeps charts aligned with existing design and branding standards.
- Chart title
- Subtext
- Legend
- Toolbar
- Y-axis values
- Y-axis label
- Grid lines
- X-axis values
- X-axis label
Do’s & don’ts
Side-by-side examples show how a single choice changes what a reader takes away.
Behaviors & actions
I built interactive examples into the documentation so people could see what happens when they hover over or click parts of a chart, with feedback such as tooltips and highlighting that reinforces information without relying on color alone.
A click-to-focus legend lets people cut clutter by isolating the series they care about and muting the rest. Interactive legends and hover-and-select for line and pie charts were documented first; other behaviors, such as zoom, drill-down and keyboard navigation, were outlined for later.
06 · Outcomes
A shared foundation for data
- Multi-brand guidance in KomodoA data visualization system in six areas, built in Storybook for designers and developers across Thermo Fisher Scientific’s brands and applications.
- Accessible color scalesOrdered categorical, extended, monochromatic, divergent and sentiment scales for light and dark mode, with a blue variation for Fisher SciApps and usage recommendations informed by color-vision testing.
- Common chart standardsShared anatomy, chart selection and interaction guidance.
- Original illustrations and interactive examplesEvery chart type illustrated and tagged by insight, plus flip cards and interactive legend and hover examples.
- A reusable referenceDo’s and don’ts and accessibility guidance every team can build from, with Developer Resources reserved for the next phase.
What I learned
- Test palettes with the people who read themContrast checkers and simulations narrowed the options, but testing with color-blind and non-color-blind participants is what shaped the final scales.
- Color is never the only cueIn dense scientific data, labels, patterns, icons and alternative text make a chart readable when color can’t carry the meaning on its own.
- Shared standards, not identical chartsInstrument software and web dashboards need different things. The system works because it standardizes the decisions, from color to anatomy to behavior, and leaves each product room to apply them.
Original project artifacts are shown as captured, some cropped or reduced in size. Charts drawn on this page use the library’s palettes with illustrative data.
The goal wasn’t to make every chart look the same. It was to give every team a shared foundation for making data easier to understand.